Stock trading trends is an effective trading strategy. Stocks either trend up or trend down or remain within a trading range. Spotting these trends is the successful trader’s objective.
Stocks trading within a range do not trade above or below the high or low in a given time period. As longer terms positional traders we are not really interested in range bound stocks. Yes, short term swing or day traders can make money on these range bound movements but trading signals are more difficult to spot.
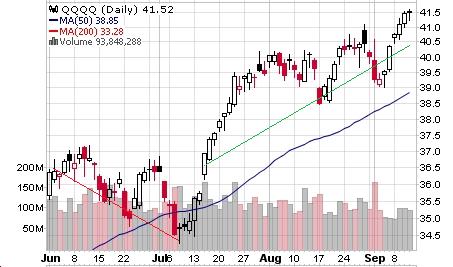
Identifying a trading range is easy to do using a chart. Very easy to do after the fact. We’re going to look at just one short term trend on the S&P500 RFT (QQQQ). It’s important to understand that we are using these charts simply to illustrate certain aspects of a trend rather than look at this as an actual trading example.

A downtrend is indicated by the red line drawn on the chart, an uptrend is indicated by the green line.

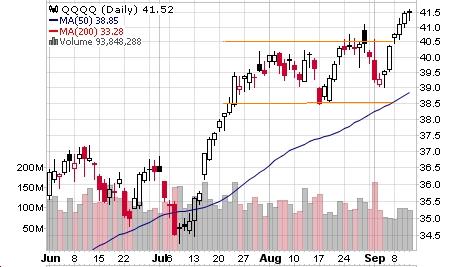
Between the two orange lines the stock is trading withing a range or range-bound. The lower orange line is known as the support level. The price where buyers are willing to buy stopping the price from falling further. The upper orange line is known as the resistance level. Buyers are reluctant to pay higher and sellers must lower prices.
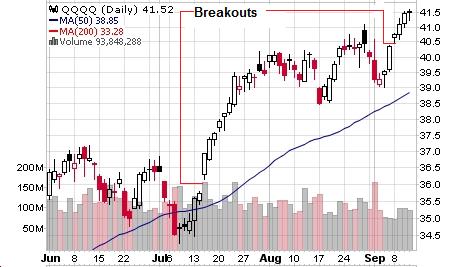
One of the ways to look for a change in direction of a trend or a move from being range-bound, is to look for breakout signals:-

Breakouts are spotted as a gap in favor of the new, in this case rising, trend.
Remember the timescale of your chart is important when looking for longer term trends.
Charts supplied by stockcharts.com. Your stock broker may provide some charting software.