Using a stock moving average is one of the building blocks to stock trending analysis. These averages can be used as trade triggers themselves or as components of more sophisticated trading signals.
A stock moving average shows the direction of a trend over a fixed time period. A moving average shows the average of a stock’s price moves over time. Usually the closing price is used but you can apply a moving average to any price: opening, low, high, mid-point
A simple moving average (SMA) is simple to calculate and draw. Even easier with any online charting package as these simple moving averages are usually displayed by default.
The mathematical equation is as follows:-
SMA = (P1 + P2 + P3 + … Pn) /n
‘P’ is the price being averaged and ‘n’ is the number of periods (hours, days, weeks, etc) in the SMA. Here’s an example:-

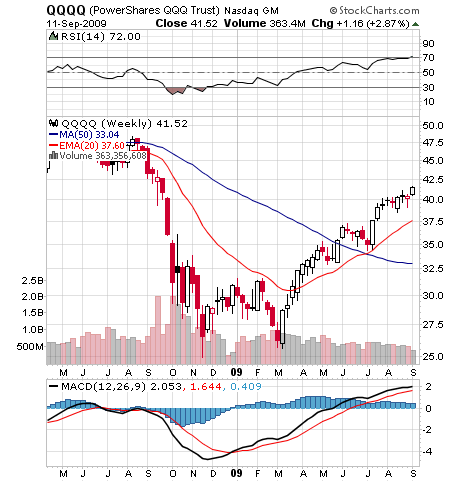
Chart supplied by stockcharts.com. Your online broker should provide some charting software.
The blue overlay line is shows a 50 day MA showing a downward trend that is just starting to level off. (Moving averages are, by definition, a lagging indicator).
Notice though, the red overlay line. This shows the exponential moving average (EMA). The calculation of this is more complex but you need not worry about that as any online charting will do it for you. As you can see the EMA more closely follows the actual trending price movements.
Either of these stock moving averages can be used as a crude trading signal. For example buy when the stock price goes above the 50 day MA. Or, likewise, buy when the stock price goes above the EMA.
Bear in mind that is a simplistic example and it’s easy to view charts with the benefit of hindsight. However we hope you can see that here we have one of the main building blocks to trend analysis and formulating a trading strategy using, at least in part, stock moving averages.