Reading stock charts is fairly easy but we thought we would lay out some basics. There are a number of different types of chart: bar charts, candlestick charts, point-and-figure charts and all are easy to create either manually or using software or internet sites. Your online broker will provide free or paid for charting packages.
Basically a stock chart shows the price of a particular stock or index over a given time period. This could be intra-day, daily weekly or monthly. The type of chart that you will need to follow will be dependent on the type of trader you are. If you are a day trader you will looking a price variations intra-day by hours or minutes. A longer term , position trader will be more interested in daily or weekly charts.
Another characteristic of stock charts is that they track the opening and closing prices in a given time period as well as the high and low price.
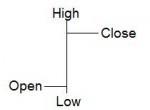
So, a daily chart will look like this:-
 Open: The price of the first trade
High: The highest price for the period
Low: The highest price for the period
Close: The price of the last trade
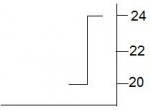
This format is the same regardless of the trading period and can be in minutes, hours, daily, weekly or monthly. So, on a daily chart a stock whose price rose over the day would look like this:-

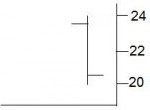
And if the price of the stock fell over that day the bar would look like this:-

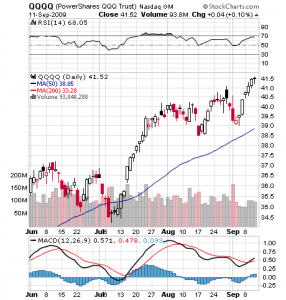
In addition to measuring price, stock charts also look at the level of trading volumes. Here’s an example:-
 Chart supplied by stockcharts.com
You can clearly see the daily trading ranges on the chart as well as the longer term trends.
Note also the trading volumes. Trading volumes are shown the same way regardless of which direction the volume is trading in but the color differentiates between buyers and sellers. Blue for buyers, red for sellers.
We will be looking at how to identify trends in subsequent articles and posts.