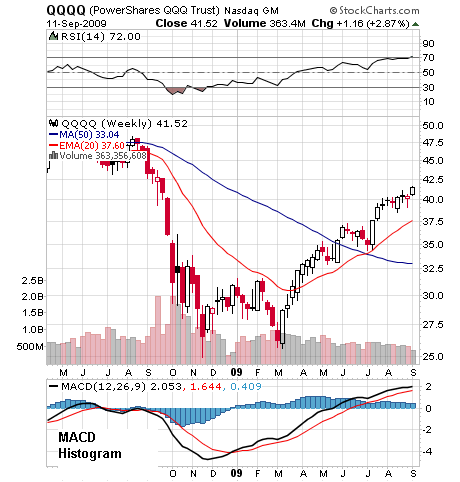
The moving average convergence divergence indicator (MACD) is a trend following indicator showing when a trend is gaining strength or losing momentum as it moves above or below a central zero line. Here is an example:-

Chart supplied by stockcharts.com. Your broker will supply charting software.
The MACD line is calculated for you and this is what it is made up from:-
1. A 12 period EMA is calculated.
2. A 26 period EMA is calculated.
3. The 26 period EMA is subtracted from the 12 period EMA to create the MACD line (the darker line in the histogram.)
Also shown on the histogram are:-
4. The MACD line is used to calculate a 9 period EMA to give the signal line (the lighter line in the histogram.)
What does it mean?
Broadly the MACD histogram gives the following trend and trading signals:-
- An uptrend when the MACD line crosses above the zero center line.
- A downtrend when the MACD line crosses below the zero center line.
Shorter term traders may consider the following:-
- A buy signal if the MACD line crosses above the signal line.
- A sell signal if the MACD line crosses below the signal line.
In the above example a buy signal would have been triggered in December 08 which would have been too early for longer term positional traders who would have waited to buy until the end of April (when the MACD line crossed above the center line for the first time.) However, it is likely that a positional trader would have been also influenced by the crossing of the EMA line and strengthening of the MACD line and entered a trade in March.